March 14, 2023 05:00 PM to 07:00 PM
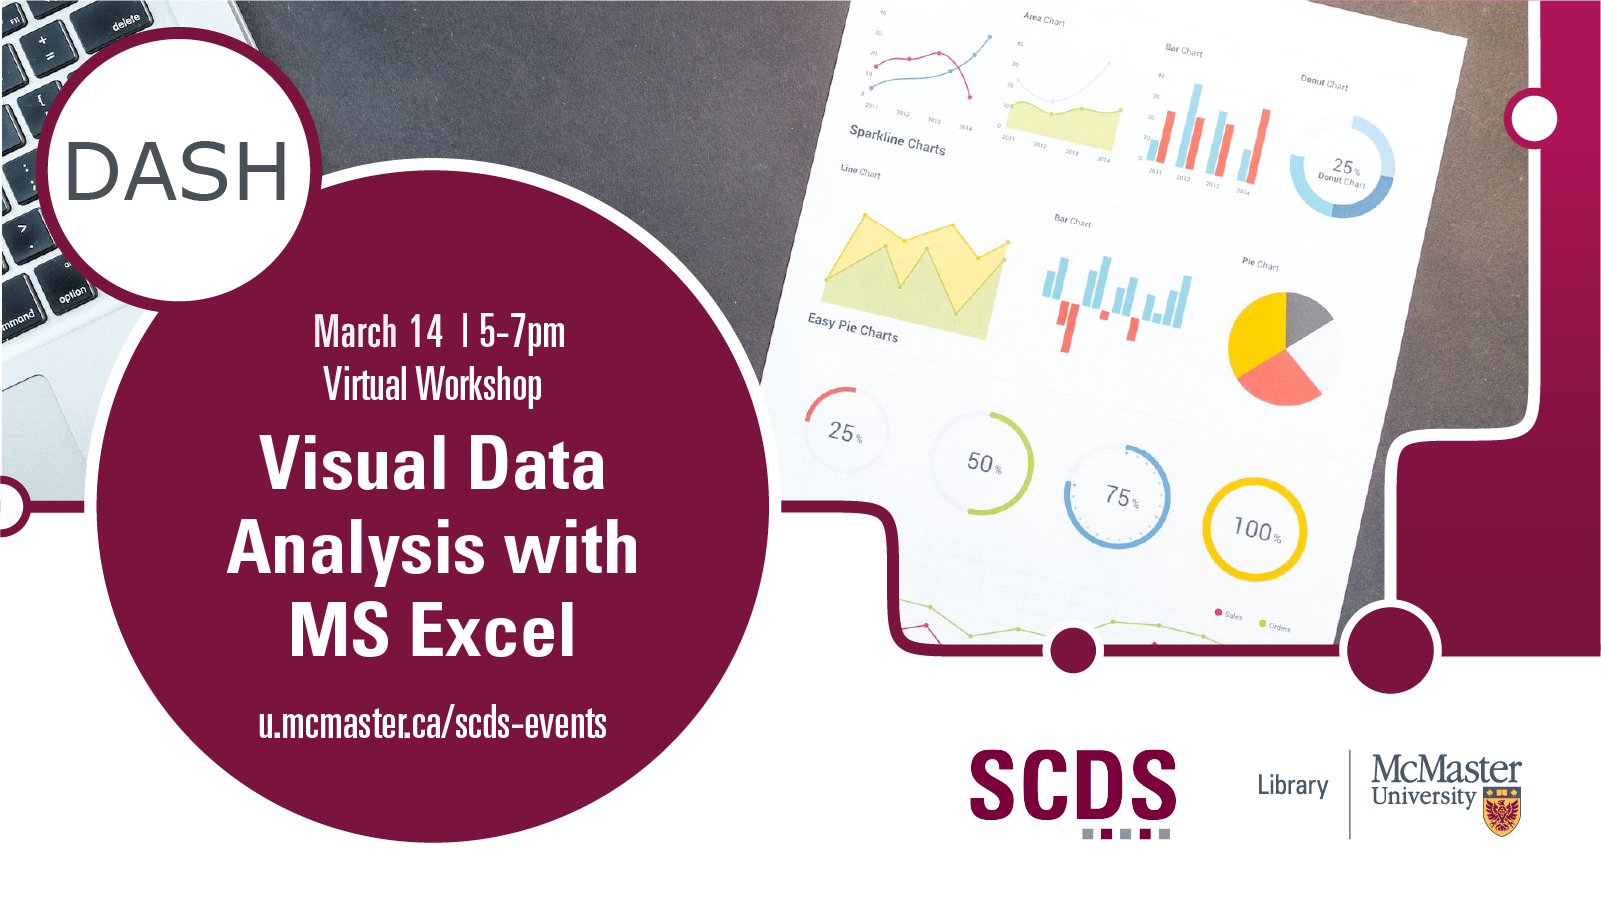
Data visualization is the graphical representation of information and data. This workshop will cover topics such as applications of data analysis basics for visualizations; effective designs of basic charts such as pie charts, bar charts, and scatterplots; time series analysis and visualization; and more advanced analytical displays like bar-in-bar, slope charts, dot plots, and bullet charts.
A basic working knowledge of MS Excel is required for this workshop.
*Presented by Shaila Jamal (DASH Support Assistant). This virtual workshop will be recorded and shared on the Sherman Centre's website.
